Matching one temperature is not correlation
Simulation can agree with measurement within 1°C and still be wrong. What a trustworthy correlation exercise requires, and the traps that make it look better than it is.
“Correlated within 0.8°C of measurement” is a reassuring line in a report. It does not, by itself, tell you whether the model can be reused on the next derivative program.
Coincidental agreement is more common than you’d think
A thermal model has many uncertain inputs: interface resistance, contact pressure, material properties, fan curves, ambient definition, heat source allocation. If two of them are wrong in opposite directions, the final temperature comes out right.
Junction temperature is the sum of several resistances.

That the right-hand side is a sum of several terms is the whole problem. Set interface resistance too low and heat load too high, and the left-hand side lands on the measured value. Then use that model to evaluate a larger heat sink and the prediction misses badly.
One temperature matching at one condition is not correlation.
What a trustworthy correlation requires
1. Multiple points at once
Not a single junction temperature — five to eight points along the heat path, simultaneously: source, spreader, sink near-end and far-end, case surface, ambient.
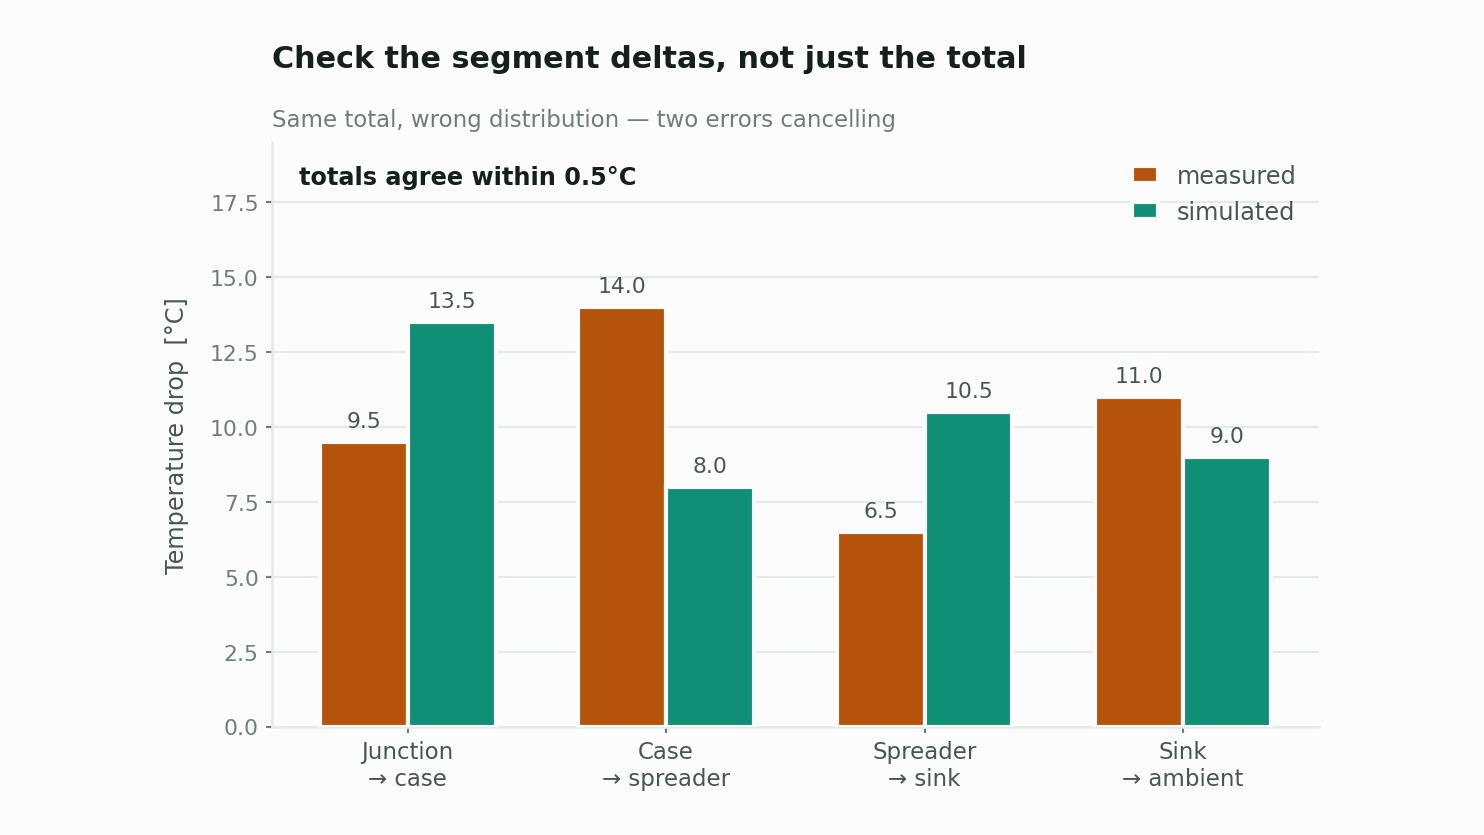
The temperature differences between segments are what have to match. If absolute temperatures agree but the gradient distribution doesn’t, two errors are cancelling somewhere.
2. Multiple conditions
At minimum three:
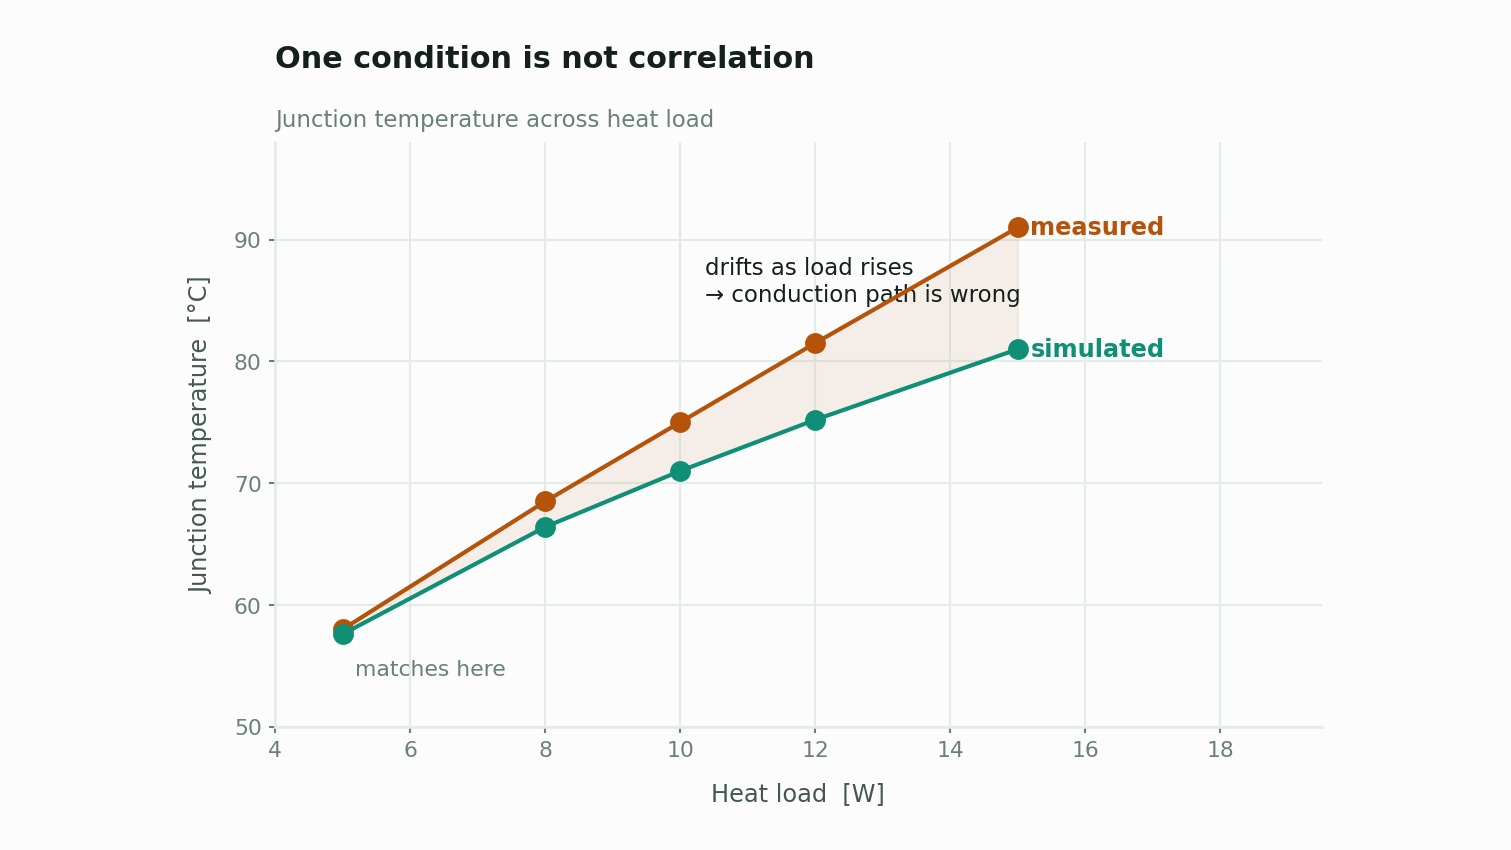
- Varying heat load (e.g. 5W, 10W, 15W)
- Varying fan RPM
- Varying ambient (e.g. 25°C, 45°C)
If agreement holds at one condition and drifts at others, the direction of the drift tells you which term is wrong. Error growing with heat load points at the conduction path; error growing with fan RPM points at convection.
3. Transient behavior
Steady-state agreement validates resistance, not capacitance. The rise curve follows a time constant set by the product of resistance and capacitance.


At steady state the exponential term disappears, so a wrong τ still gives the right final temperature. For products where transient behavior matters — peak loads, throttling — compare the slope and the time constant as well.
Measurement-side traps
Often it isn’t the simulation that’s wrong.
- Thermocouple attachment — adhesive thickness, attachment angle, conduction loss through the leads. On small components, lead loss alone can exceed 1°C.
- IR emissivity settings — leaving a metal surface at a default 0.95 reads far too cold. Create a reference patch with black tape or paint and calibrate against it.
- Inconsistent ambient definition — confirm that simulation ambient and chamber setpoint refer to the same location. Local air near the product is usually warmer than the chamber setting.
- Not actually at steady state — large products need 30–60 minutes. Comparing 15-minute data makes the simulation look consistently hot.
Calibration needs a physical justification
Adjusting interface resistance until the numbers line up is curve fitting, not calibration. Any adjustment has to land within a physically plausible range, and you should be able to explain why that value.
“Interface resistance set to 1.8× the datasheet value” is fine on its own terms — if your actual assembly pressure is below the datasheet condition and the D5470 curve really does give 1.8× at that pressure. Without that reasoning, the model will miss again on the next design.
What belongs in a correlation report
- Measurement point locations and attachment photos
- Simulation vs. measurement per condition (absolute values and segment deltas)
- List of adjusted inputs with justification for each
- Residual error and an assessment of its cause
- The validity envelope of this model — over what range it can be trusted
That last item matters most. Models do not generalize indefinitely. Stating the range you validated is what makes the model useful.
If you need a review of an existing model’s credibility, or a correlation exercise run properly, get in touch.