Why datasheet conductivity is the wrong way to pick a TIM
A 6 W/m·K product can perform worse than a 3 W/m·K one. Here's why resistance — not conductivity — is the number that matters, and how to compare candidates properly.
The most common question in a TIM selection meeting is “what’s its W/m·K?” Deciding on that number alone gets it wrong often enough to be worth writing about.
Conductivity is a material property; resistance is an assembly outcome
The conductivity k printed on a datasheet belongs to the material. What you actually need to know is how many degrees you drop across that interface — thermal resistance.
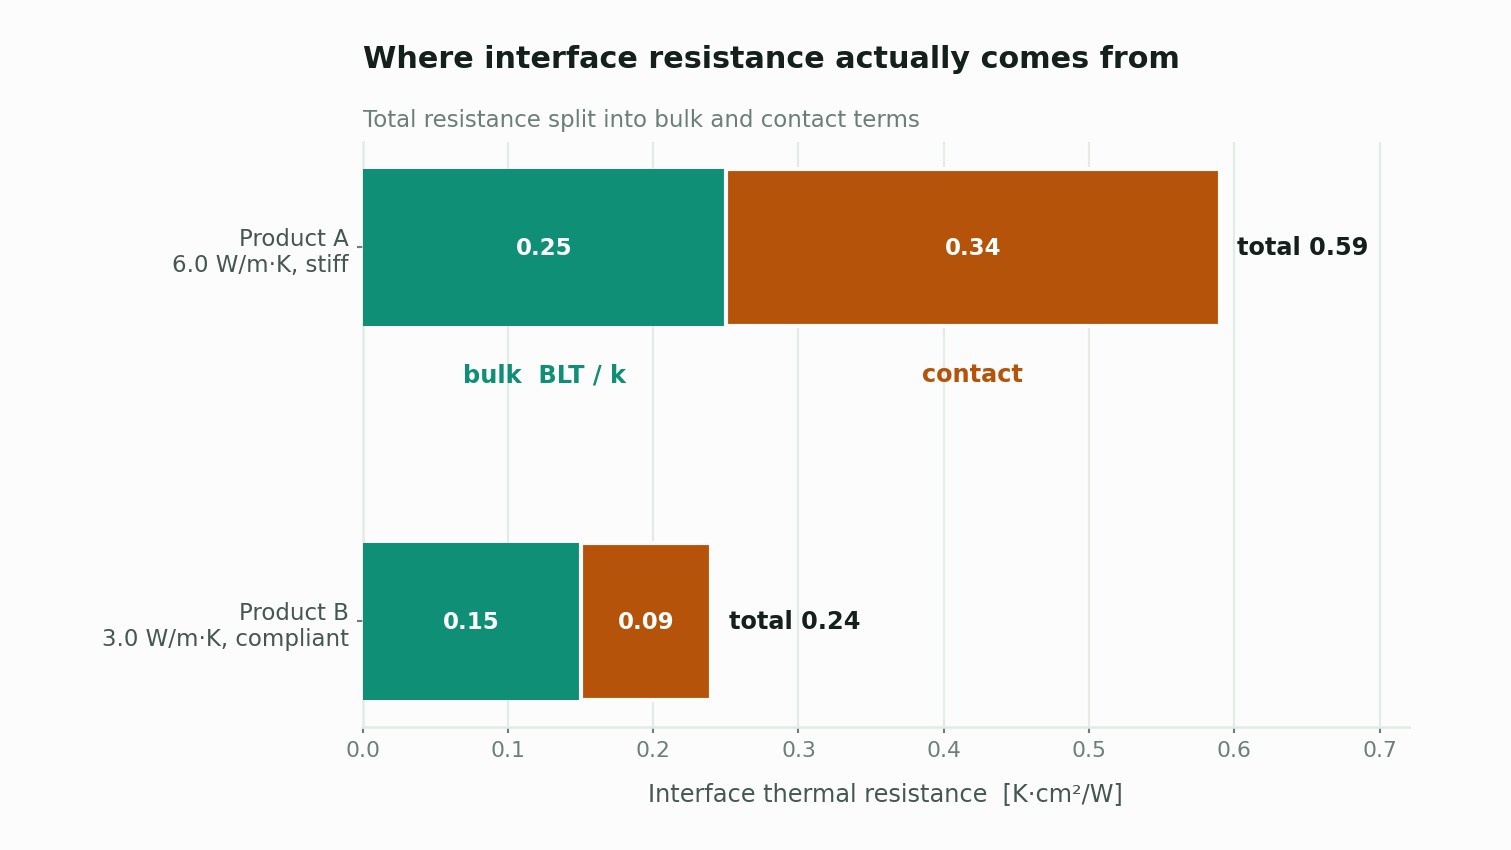
Total interface resistance looks roughly like this:

BLT— bond line thickness, the TIM thickness that actually survives assemblyR_contact— contact resistance between the TIM and each mating surface
The second and third terms are the problem. The datasheet only informs the first.
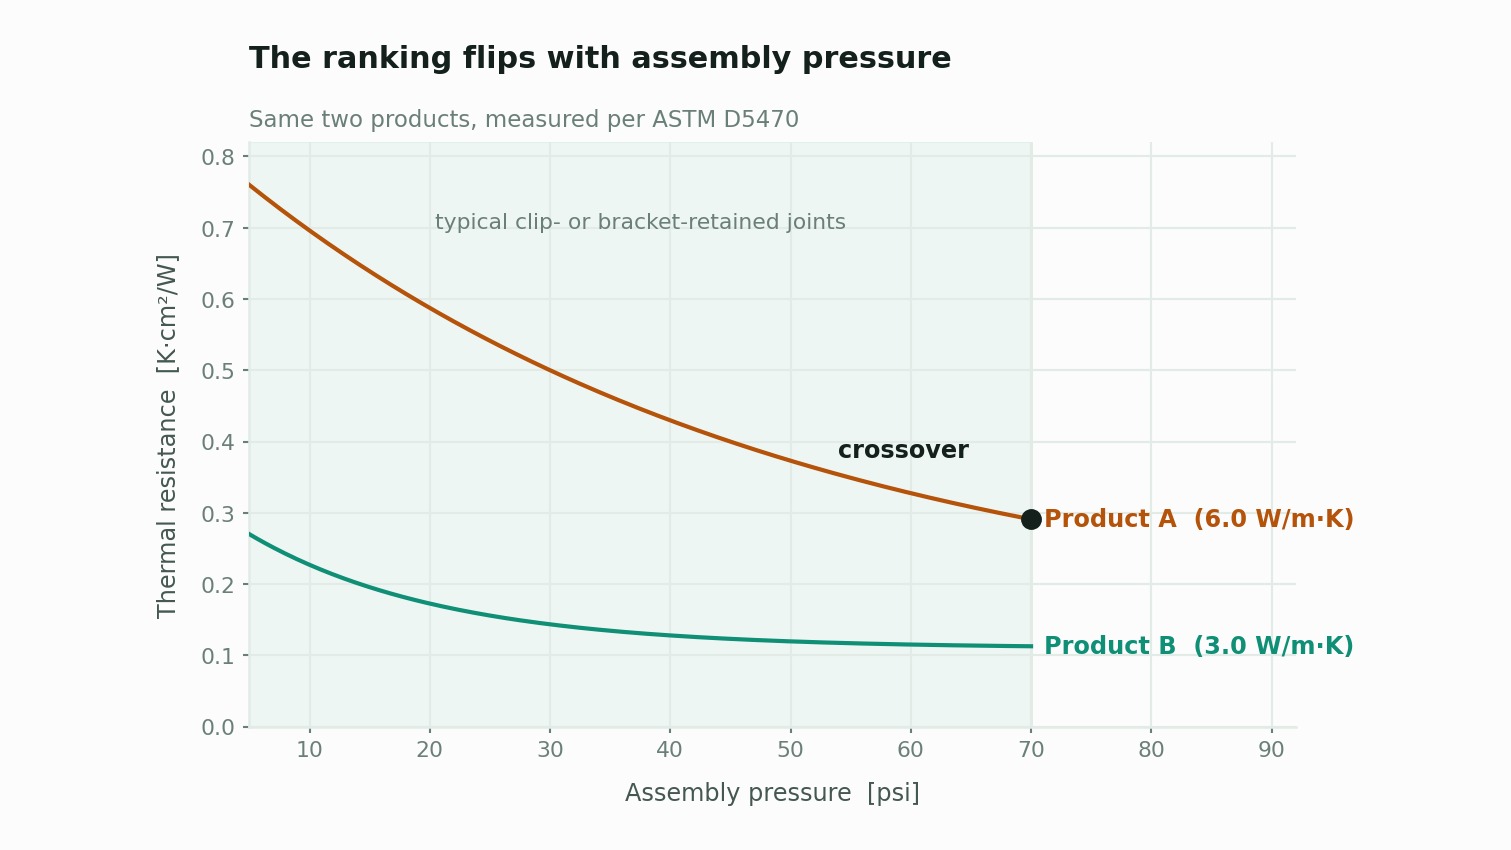
Where the ranking flips
A pattern we see repeatedly:
| Product A | Product B | |
|---|---|---|
| Datasheet conductivity | 6.0 W/m·K | 3.0 W/m·K |
| Viscosity / compliance | High (stiff) | Low (spreads well) |
| BLT after assembly | 150 μm | 45 μm |
| Interface contact resistance | Large | Small |
| Measured total resistance | Higher | Lower |
Product A has twice the conductivity and performs worse. It is stiff, so it does not compress thin, and it does not conform to surface roughness, leaving contact resistance behind.
This inversion is especially common in low-pressure assemblies — thin covers, plastic brackets, spring clip retention. With screw-clamped joints that can develop real pressure, the high-conductivity product wins. In other words, the answer depends on your mechanical structure, not on the material alone.
What to look at instead
1. Ask for the ASTM D5470 curve
Good suppliers have resistance plotted against pressure and thickness. If a vendor offers only a single conductivity number, request the data. If they don’t have it, that is itself information.
2. Compare at your design pressure
“0.1 K·cm²/W at 40 psi” only matters if your structure can develop 40 psi. Calculate your actual assembly pressure first, then compare candidates at that point.
The unit is area-normalized for a reason — it lets you compare parts of different sizes.

3. Check what happens over time
- Pump-out — grease migrating out of the interface under thermal cycling
- Dry-out — hardening as oil components evaporate
- Compression set — pads losing restoring force
The product with the best initial performance is not reliably the best after 1,000 cycles. Ask for post-reliability data alongside initial data.
4. Ask about production variation
Dispense volume tolerance, bead geometry, and cure conditions move real BLT considerably. This is the single most common reason prototype results fail to reproduce in volume.
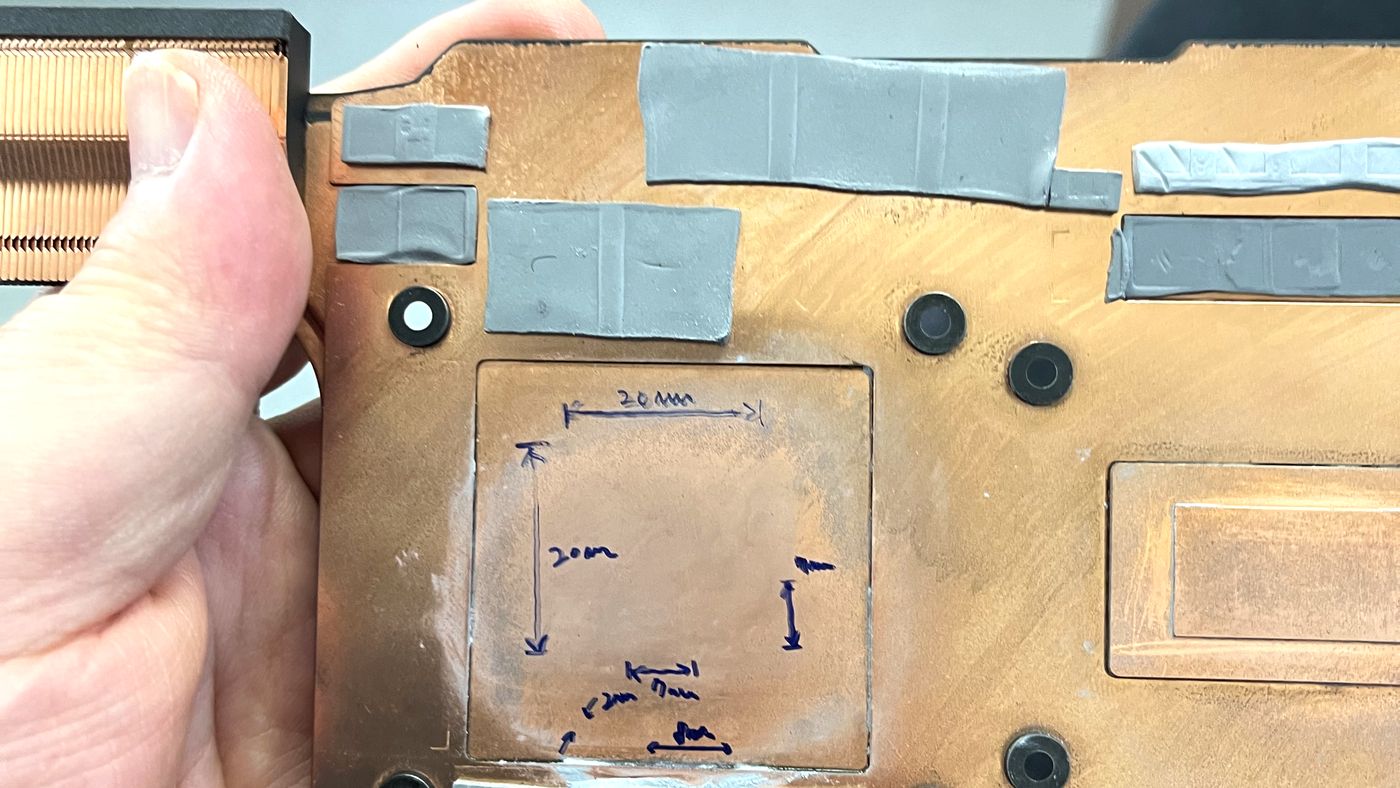
Pad position, pad thickness, and how far it compresses on assembly set the final bond line. The conductivity figure on the datasheet tells you none of these.
Summary
You are not buying a material; you are buying an interface design. Conductivity is one input to that design.
Securing these three things at selection time removes most of the risk:
- Measured resistance at your design pressure (not a single k value)
- Resistance change after reliability testing
- BLT variation under production dispense conditions
If you need interface resistance measurement or a TIM comparison study, get in touch. We provide ASTM D5470 measurement and candidate comparison reports.